Results & Analytics
Results in ProNova52 are live, never stale. The moment a participant submits a response the dashboards update — risk scores recalculate, distributions shift, completion rates climb. Filter by date range, status, or individual participant to interrogate the data behind the headline numbers.
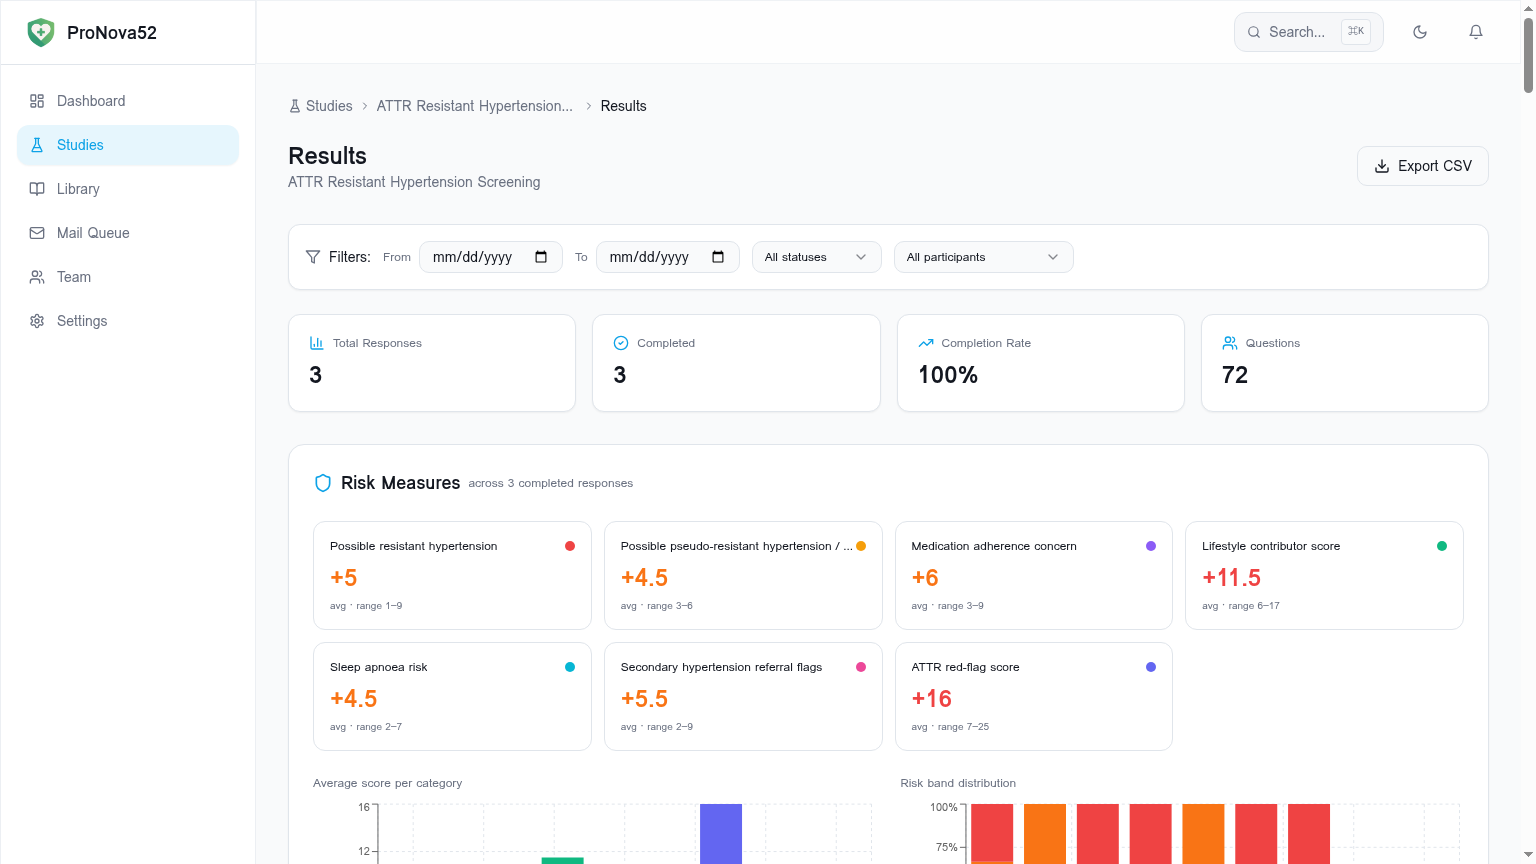
Risk measures and score aggregation
Every risk category you defined in the Study Builder is summarised here — average score, range across the cohort, and individual band distribution. Bands are colour-coded so emerging signals are visible at a glance.
Per-response drill-down
Click any response to see the full answer set, the participant's risk profile, and every timestamp from invite through completion. Researcher role users see the data with PII automatically redacted for blinded review.
Export for statistical analysis
Export the full response set as CSV with one click. Question identifiers are stable across study revisions so longitudinal joins remain valid as your protocol evolves.
Capabilities
- Real-time completion rate and response counts
- Risk category averages with band distributions
- Per-question response breakdown charts
- Date, status, and participant filtering
- Per-response drill-down with full answer history
- CSV export with stable question identifiers
- Researcher-role PII redaction
Typical use cases
- Weekly trial steering committee dashboards
- Cohort-level PROM trend analysis
- Statistician handoff via CSV export to R/Stata/Python